The average person makes 35,000 decisions a day, according to scientific research. While we try hard to apply logic to our decisions, sometimes we don’t have all the information we need and several factors can limit our ability to make the right decision. Research also tells us that many of these decisions are influenced by biases, emotions, and memories.
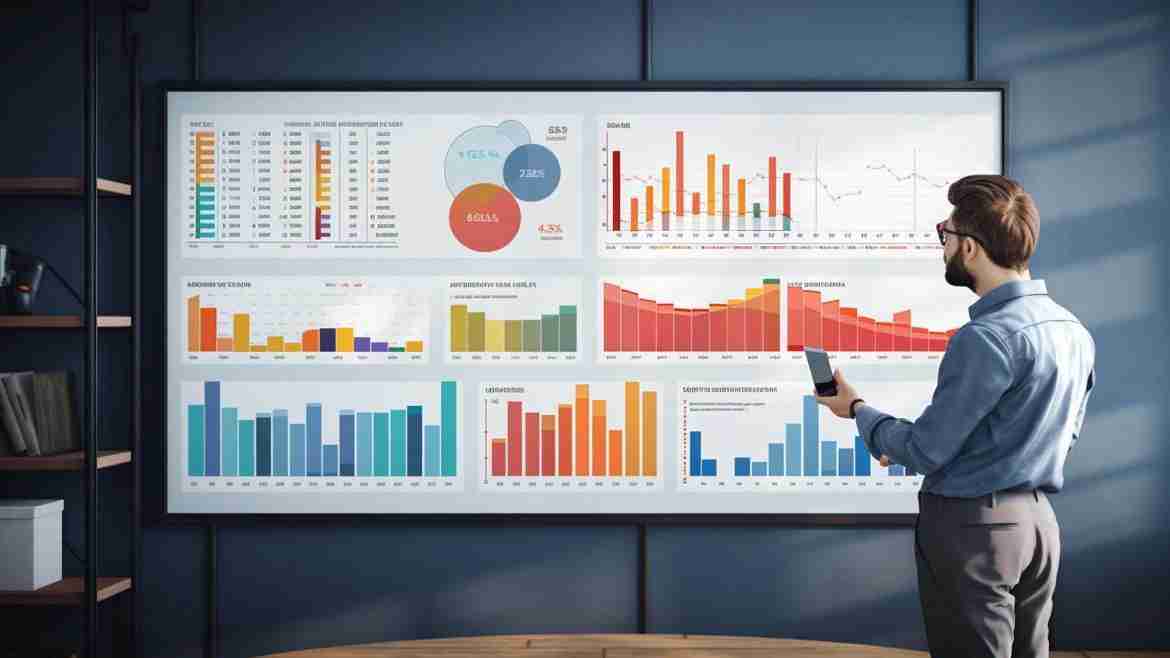
In business, these decisions are critical. Luckily, in the era of big data, we have the ability to make better decisions based on our client’s historical financial data. But even all this data is useless unless it is transformed into insights we can use. This is the purpose of data visualization. When data is visualized, patterns become more obvious and it is easier to discover actionable conclusions.
How Data Visualization helps in Decision Making
“A Picture Is Worth a Thousand Words”
By using charts, diagrams, maps, and other visual elements, data visualization goes beyond presenting numbers to tell a story. With data visualization, the business can spot trends, patterns, exceptions, and opportunities more quickly, and then make informed business decisions with actionable insights.
Data visualization is fundamentally a storytelling tool. Using it, both financial and non-financial users can make key business decisions without wading through complicated spreadsheets with endless columns of figures. Due to the fact that 65 percent of the population is visual learners, facilitating employees’ ability to analyze, interpret, and apply financial data effectively can increase their competitiveness.
Read More at https://pathquest.com/knowledge-center/blogs/data-visualization-can-make-you-a-better-decision-maker/